Monitoring and Parsing access.log file for Nginx on Linux
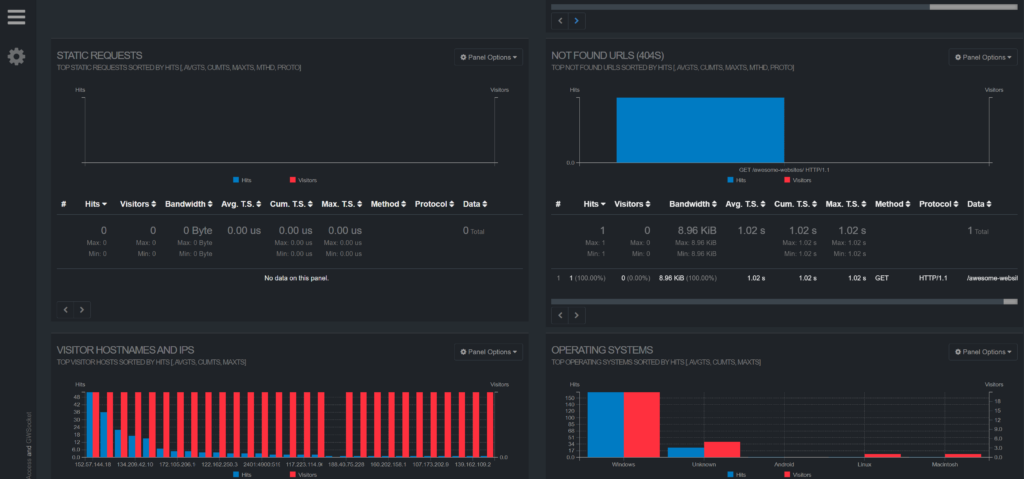
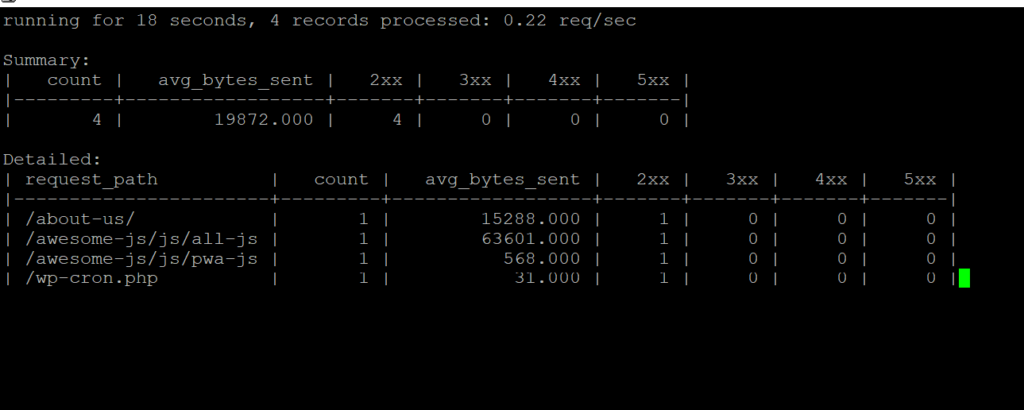
In this tutorial, we are going to see various command-line tools that can be used to parse access.log file for Nginx using awk. We will also see how we can monitor in real-time the access.log using ngxtop and finally, we will how to use GoAccess to quickly generate a visual server report of various statistics of access.log on the fly.
All the examples that are shown in this tutorial assume that your Nginx setup was done using WordOps.
Using awk for parsing access.log file
in the examples shown below ‘awxdocs.com.access.log‘ is the name of the access.log file for awxdocs.com website, while using it on your system replace it with the path to your access.log file. All these commands are run within /var/log/nginx directory.
Get entries within the last N hours using awk
In the example below we are showing entries to access.log file for the last 2 hours
|
1 |
awk -vDate=`date -d'now-2 hours' +[%d/%b/%Y:%H:%M:%S` ' { if ($4 > Date) print Date FS $4}' awxdocs.com.access.log |
Get entries within relative timespan using awk
|
1 |
awk -vDate=`date -d'now-4 hours' +[%d/%b/%Y:%H:%M:%S` -vDate2=`date -d'now-2 hours' +[%d/%b/%Y:%H:%M:%S` ' { if ($4 > Date && $4 < Date2) print Date FS Date2 FS $4}' awxdocs.com.access.log |
Get entries within absolute timespan using awk and save it
In this example, we are extracting the entries from access.log and saving them to another file to make it easier to analyze by opening the file.
|
1 |
awk -vDate='[18/Oct/2021:23:39:00' -vDate2='[18/Oct/2021:23:48:02' ' { if ($4 > Date && $4 < Date2) print $0}' awxdocs.com.access.log > between-awxdocs.access.log |
Get IP address using awk and sort number of requests per IP by count
In this example, we are listing the IP address and number of requests made by them
|
1 |
awk '{print $1}' awxdocs.com.access.log | sort | uniq -c | sort -rn |
If you want to show only the top 10 IP addresses then you can use
|
1 |
awk '{print $1}' awxdocs.com.access.log | sort | uniq -c | sort -rn | head |
Using awk search for the count of requests that missed the Cache
In this example, we will show the total count of URL requests that missed the cache
|
1 |
awk '($3 ~ /MISS/){print $1}' awxdocs.com.access.log | awk '{print $1}' | sort | uniq -c | sort -r | awk '{sum += $1};END {print sum}' |
you can also list them using
|
1 |
awk '($3 ~ /MISS/){print $1}' awxdocs.com.access.log | awk '{print $1}' | sort | uniq -c | sort -r |
Similarly, we can list all the URLs for which Cache was hit
|
1 2 3 |
awk '($3 ~ /HIT/){print $1}' awxdocs.com.access.log | awk '{print $1}' | sort | uniq -c | sort -r | awk '{sum += $1};END {print sum}' awk '($3 ~ /HIT/){print $1}' awxdocs.com.access.log | awk '{print $1}' | sort | uniq -c | sort -r |
Using awk to pattern match multiple columns and then list them
We will show how to match multiple columns and list those lines that are matching, in this example, we are showing the count of all the cache miss requests for the google bot
|
1 |
awk '$3 ~ /MISS/ && $15 ~ /Googlebot/ {print $1}' awxdocs.com.access.log | awk '{print $1}' | sort | uniq -c | sort -r | awk '{sum += $1};END {print sum}' |
List all HTTP response status codes using awk
|
1 |
awk '{print $9}' awxdocs.com.access.log | sort | uniq -c | sort |
List top 10 404 URLs using awk
|
1 |
awk '($9 ~ /404/)' awxdocs.com.access.log | awk '{print $7}' | sort | uniq -c | sort -r | head |
Using ngxtop to monitor access.log in real-time
we will see how to set up ngxtop on Ubuntu and then the most useful commands to monitor the Nginx access.log file for WordOPS.
Install PIP
|
1 |
apt install python-pip |
Install ngxtop
|
1 |
pip install ngxtop |
Monitor access.log file in real-time with log format defined as per WordOPS Nginx setup
|
1 |
ngxtop -l /var/log/nginx/awxdocs.com.access.log -f '$remote_addr $upstream_response_time $upstream_cache_status [$time_local] $http_host "$request" $status $body_bytes_sent "$http_referer" "$http_user_agent"' |
Parsing access.log file to show the summary
|
1 |
ngxtop -l /var/log/nginx/wpoets.com.access.log -f '$remote_addr $upstream_response_time $upstream_cache_status [$time_local] $http_host "$request" $status $body_bytes_sent "$http_referer" "$http_user_agent"' --no-follow |
Using GoAccess to create reports by parsing access.log file

We will install the GoAccess on ubuntu and learn the commands to generate the reports in HTML format.
Installing GoAccess on Ubuntu
|
1 |
apt-get install goaccess |
Updating the GoAccess configuration for WordOPS
you can find the exact path of goaccess.conf file being used using the following command
|
1 |
goaccess --dcf |
in our case, it was at /etc/goaccess.conf, so go ahead and edit this file,
|
1 |
nano /etc/goaccess.conf |
and put the following lines at the end of the file, and save it.
|
1 2 3 |
time-format %T date-format %d/%b/%Y log-format %h %T %^ %C[%d:%t %^] %v "%m %U %H" %s %b "%R" "%u" "%H" |
in case your log format is different you will have to update the log-format using custom log format given on the GoAccess website.
Generating real-time reports from Nginx access.log
this command shows the real-time stats
|
1 |
goaccess /var/log/nginx/awxdocs.com.access.log -c |
Generating HTML report from access.log file
you can export the statistics shown on the terminal file as a self-contained HTML file using the command below.
|
1 |
goaccess /var/log/nginx/awxdocs.com.access.log -o /var/www/awxdocs.com/goaccess.html |
This HTML file can then be opened in the browser for easier access.
