Published on 10/19/2021
Published by Pratik Takle
How to use e-charts service
- Step 1
- Goto Awesome Core -> services module and add following lines, and save (most of these lines will be present, make sure last line is added if missing.)
[services.add echarts service_label=’E Charts’ post_type=’echarts’ desc=’Echarts Service’ /]
- Goto Awesome Core -> services module and add following lines, and save (most of these lines will be present, make sure last line is added if missing.)
- Step 2
- Download file from – https://github.com/WPoets/awesome-apps/tree/main/services/e-charts
- Now import e-charts.xml via wordpress importer.
- In case of updating
- Trash the echarts modules and empty the trash
- Import this xml file.
- Step 3
- Check following modules in imported service
- pie-borderradius-chart – config for donut chart
- mixed-line-bar-chart – config for line and bar mixed chart
- smoothed-line-chart – config for waves chart
- stacked-bar – config for stacked bar mixed chart
- basic-bar – config for single bar chart
- readme file for charts arrays – raw json examples for all charts
- Check following modules in imported service
- Step 4
- Config element lists – https://echarts.apache.org/examples/en/index.html
- in readme file for charts arrays all data arrays are mentioned to config charts.
- Lets see one example for bar-chart,
-
1234567//** this is html for bar graph**//[aw2.get token set=module.chart_id /]<div id="[module.chart_id /]" class="bar-chart" style="height:100%;"></div>[echarts.basic-bar chart_id="{module.chart_id}" chart_data="{chart_data}" /]
-
1234567891011121314151617181920212223242526272829303132[arr.create set="chart_data"][legend]Target,Registered[/legend][xaxis][type]category[/type][data]Jan, Feb, Mar, Apr, May, Jun, Jul,Aug,Sep,Oct,Nov,Dec[/data][/xaxis][yaxis][min]100[/min][max]600[/max][interval]100[/interval][/yaxis][grid][height]50%[/height][/grid][series][bar1][name]Target[/name][type]bar[/type][color]#ffff4a[/color][background_color]#CCCCCC[/background_color][bargap_per]10[/bargap_per][data]600,510,400,570,350,585,600,400,580,600,500,585[/data][/bar1][bar2][name]Registered[/name][type]bar[/type][color]#2ec751[/color][background_color]#CCCCCC[/background_color][data]500,590,250,570,260,600,600,490,495,495,595,350[/data][/bar2][/series][/arr.create]
- In above array config,
- there are two bars in chart – bar1 and bar2
- in series elements, data about these two bars are derived
- output will be as
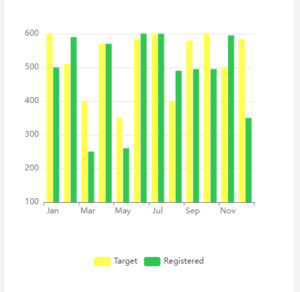
- As you can see, names for bars are Target and Registered
- which are mentioned in legend array element.
- To add values for x-axis element is used as
- xaxis -> data
- To add values for y-axis element is used as
- yaxis -> min, max, interval (since it is numeric )
- to config bars, e-chart is using
- series array element
- in which there are different config elements which are going be there as they are neeeded.
- config list – https://echarts.apache.org/examples/en/editor.html?c=bar-simple
- There are many other elements you can use as per your need
- you can find them at – https://echarts.apache.org/en/option.html#title
- Identify your requirement, plot your values, choose your chart accordingly thats it your done.
-
Happy coding!